Healthcare headlines are filled with burnout, staffing shortages, rising denials, and shrinking margins. But which of these are impacting your practice?
The answer lies in metrics.
However, measuring everything often creates more confusion than clarity. Choosing the right KPIs (Key Performance Indicators) provides the insights needed to make informed decisions.
In this article, we’ll explore the KPIs that matter, so you can focus your efforts where they actually drive results.
Improving practice performance comes down to tracking the right KPIs and benchmarking them effectively.
KPIs show what’s happening, while benchmarking shows how you compare to industry standards and your past performance.
Here are the core KPIs practices should prioritize:
1) Operating Margins
The operating margin reflects the financial health of your practice. It shows the revenue that remains after operating expenses and helps identify creeping up expenses.
How to calculate:

While operating margins for physician-owned groups increased by 41.6% from 2011 to 2024, nearly half of medical groups reported a decline in 2025. Tracking this metric provides early visibility into financial risks and performance gaps.
2) Net Collection Rate
The net collection rate (NCR) is the percentage of revenue (after contractual adjustments) that actually makes it into your practice.
How to calculate:

Ideally, NCR should be 95% or higher. A lower NCR signals revenue leaks due to issues such as denials, incomplete documentation, coding errors, or front-end inefficiencies.
3) Days in A/R
Days in accounts receivable (A/R) reflect the time it takes for your practice to convert services into payments. Long A/R days reduce the likelihood of reimbursement and slow cash flow.
How to calculate:

Note: Average daily charges = Total revenue/ 365
Elevated AR days signal inefficiencies within the system. Keeping AR days within 30–40 days ensures smooth practice operations.
4) Denial Rate
The denial rate measures the percentage of claims rejected by payers.
How to calculate:

Rising denial rates indicate issues such as errors in patient details, coding, or documentation. Keeping denial rates below 5% protects revenue and maintains smooth operations.
5) No-show Rate
The no-show rate measures the percentage of scheduled appointments that patients miss without canceling or rescheduling. No-shows are hidden revenue leaks.
How to calculate:

A no-show rate of <5% projects optimized revenue capture. Timely reminders and self-scheduling options help reduce no-shows and optimize scheduling.
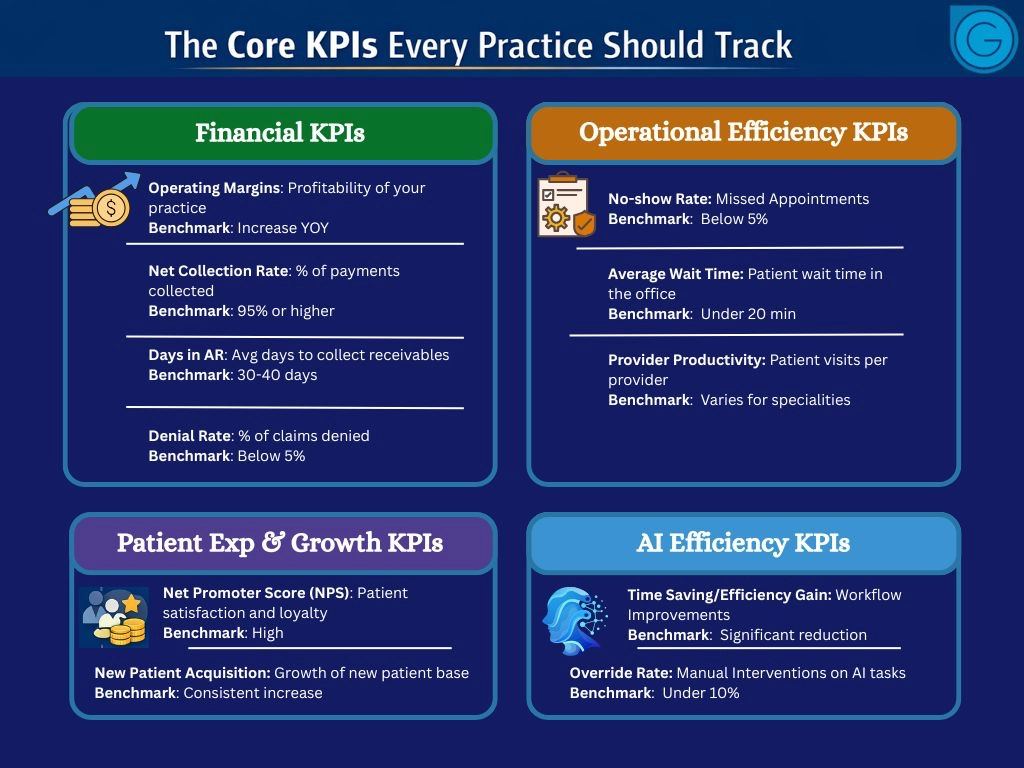
Medical Practice KPIs
6) Average Wait Time
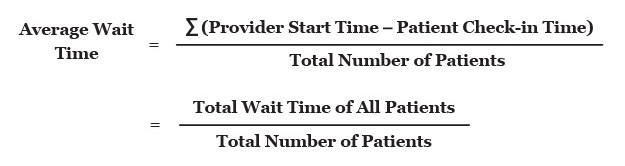
Patient wait time measures the time from patient check-in to the provider encounter. Long wait times, typically beyond 20 minutes, lead to frustration and lower NPS scores.
How to calculate:
7) Provider Productivity
Provider productivity metric measures how each provider contributes to the overall growth of your practice. However, measurement based on RVUs can shift focus from quality to quantity.
A balanced scorecard that includes productivity, patient satisfaction, quality outcomes, team-based goals, and readmission rates provides a more realistic view of performance.
8) Net Promoter Score (NPS)
Net Promoter Score (NPS) measures how likely patients are to recommend your practice. It’s a strong indicator of patient satisfaction and loyalty.
NPS measures patient loyalty using a 0–10 recommendation score:
How to calculate:

9) New Patient Acquisition
New patient acquisition reflects how effectively you attract new patients and expand your reach.
How to calculate:

While volume matters, understanding which channels drive consistent growth helps optimize marketing efforts.
More than 8 in 10 physicians report using AI.
Success, however, resides in its performance. Tracking AI-specific KPIs helps determine whether these tools are delivering efficiency gains and ROI.
Here are key AI KPIs you should track:
10) Time Savings/Efficiency Gain
AI promises to save time and reduce burnout, but is it delivering?
Time saved per task measures the time AI saves in coding, documentation, eligibility checks, and prior authorizations.
A related metric, efficiency gain, compares task completion times before and after AI implementation to quantify productivity improvements.
How to calculate:

Together, these metrics measure the real impact of AI.
11) Override Rate
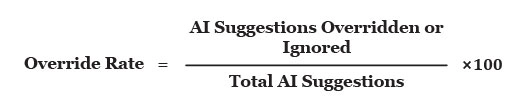
The override rate measures the number of times staff overrides or disregard AI-generated recommendations.
A low override rate (typically below 10%) indicates AI is reliable, while higher rates may signal inaccurate output or poor workflow integration.
How to calculate:
AI also meaningfully influences traditional practice KPIs. For instance, AI scribes and automated coding solutions boost documentation accuracy, increase the clean claim rate, and reduce denials.
Tracking the right KPIs helps uncover bottlenecks and inefficiencies. An RCM dashboard collates key metrics, providing real-time visibility into performance and opportunities for improvement.
The Glenwood RCM dashboard centralizes your most important metrics, supporting smarter decisions, greater efficiency, and improved revenue performance.
Let’s connect and turn your KPIs into actionable strategies!
Schedule a Free Consultation!


